Agentic Allocation of
Software Engineering Resources
From research to a SaaS business case
MBA Thesis · Leonidas Boutsikaris
The problemEvery sprint: who works on what?
A people decision about a company's largest cost: salaries.
Today it is made in meetings, spreadsheets and from memory, using data scattered across many tools.
Reference customer NovaSoft: a European software firm with 120 engineers in 12 teams.
Source: Thesis §5.1: NovaSoft is the illustrative reference customer used in the case study.
Why it mattersThe cost of getting it wrong
Overload
A few experts are pulled into everything, which leads to burnout.
Delays
Deadlines slip when the right skill is unavailable.
Distrust
With no written rationale, decisions feel arbitrary.
one engineer
These are HR problems as much as operational ones: overload drives turnover.
Source: 90–200% of annual salary to replace an employee: Allen (2008), Retaining Talent, SHRM Foundation (cited in thesis §5.6). Overload → burnout & turnover: Maslach & Leiter (2016); Brooks (1995).
Research questionsWhat the thesis asks
Source: Thesis §1 and §6.2 research questions; business-case question answered in Chapter 5.
ApproachTwo ways to staff a sprint
Optimiser
Computes the cheapest plan that fits skills, capacity and deadlines.
✓ instant & optimal
✗ a black box
AI agents
Developer, Manager and Stakeholder agents negotiate a plan.
✓ every decision has a reason
✓ small models, run locally
Tested on 18 staffing scenarios with 4 open-weight AI models.
Source: Thesis §3 (MILP and LangGraph multi-agent design); §4.1: 18 synthetic instances (3 sizes × 6 seeds); models in Table 1.
ResultsWhat we found
the best plan
cost vs. the optimum
cheap to run
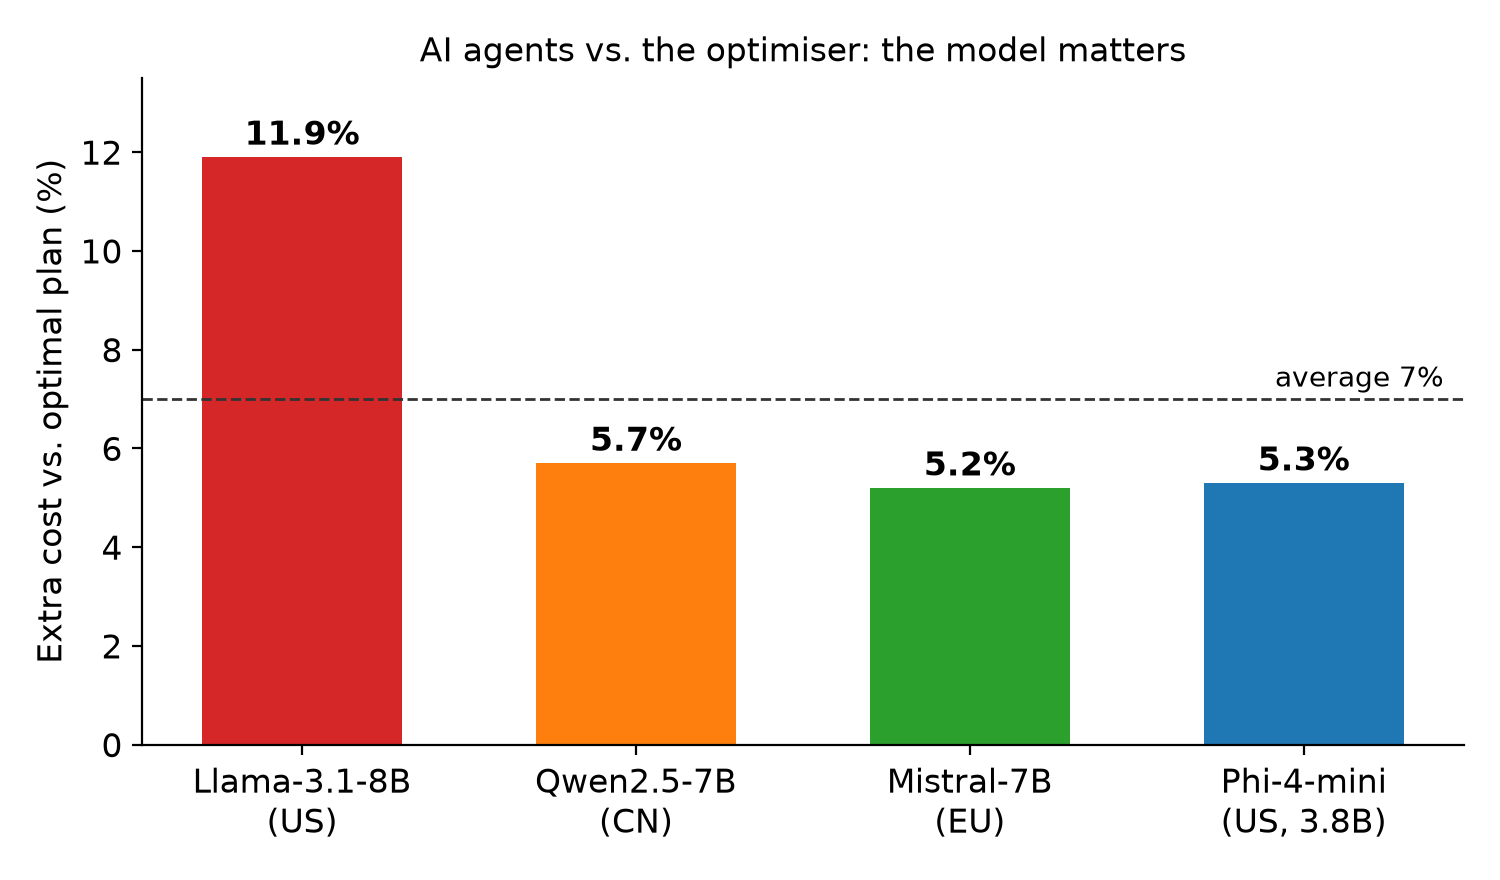
Source: Thesis §4.2 / Table 2: MILP mean 0.120 s, 95.6% completion. §4.3–4.4.1 / Table 3 & Figure 6: mean agent gap 7.0%; Phi-4-mini = 3.8B parameters (Abdin et al., 2024).
Key insightCombine them
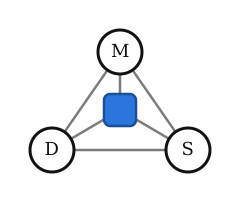
efficiency
transparency
buy-in
Augment managers, don't replace them (Raisch & Krakowski, 2021). People trust AI that is transparent and keeps humans involved (Glikson & Woolley, 2020).
Source: Raisch & Krakowski (2021), Academy of Management Review 46(1); Glikson & Woolley (2020), Academy of Management Annals 14(2). Thesis §5.2.
Part 2
The Business Case
Turning the findings into a product: AllocAgent
ProductAllocAgent: product vision
A fair, explainable, near-optimal staffing plan for every team, inside the tools it already uses, with people keeping the final word.
Plug-ins
GitHub, Notion, Teams & Workday. No new app to learn.
People decide
Engineers accept or decline in Teams; a manager approves.
EU & audit-ready
Data stays in the EU / customer tenant; every decision is logged.
Source: Thesis §5.3 Product Vision and Design; Table 4 Platform Integrations.
ProductHow it works

Source: Thesis §5.3, Figure 9: Product Architecture of the Proposed SaaS Solution.
Business modelBusiness Model Canvas
Fair, explainable decisions
Less planning effort
Lower burnout & turnover
EU data sovereignty
Audit-ready
Buyer: CTO / VP Eng., HR as co-sponsor
Source: Thesis §5.4, Table 5. Framework: Osterwalder & Pigneur (2010).
CustomersTwo buyers, two value stories
Engineering leaders
HR / People leaders
Land with the CTO, expand when HR joins as co-sponsor.
Source: Thesis §5.4 value proposition for two customer groups (Osterwalder et al., 2014).
MetricsMetrics that prove value
• Skill utilisation
• Acceptance rate
• Planning hours / sprint
• Cost per delivered task
• HCROI
• Revenue / employee, turnover
Balanced scorecard (Kaplan & Norton, 1992); Huselid (1995); Fitz-enz (2009); Bakker & Demerouti (2007).
Source: Thesis §5.5. Kaplan & Norton (1992); Huselid (1995); Fitz-enz (2009); Bakker & Demerouti (2007); SPACE framework for team-level reporting.
MetricsFrom thesis metrics to HR KPIs
Source: Thesis §5.5, Table 6: From Technical Metrics to HR and Productivity KPIs. HCROI per Fitz-enz (2009).
RevenuePricing
Starter
- Optimiser
- GitHub + Notion
Team
- Everything in Starter
- AI agents in Teams
Business
- Everything in Team
- Workday
- HR dashboard
- Audit log
Enterprise
- Private deployment
- Compliance pack
The free tier drives adoption through the marketplaces.
Source: Thesis §5.6 Pricing. Tier prices are the thesis's proposed list prices.
Business caseNovaSoft: first-year return
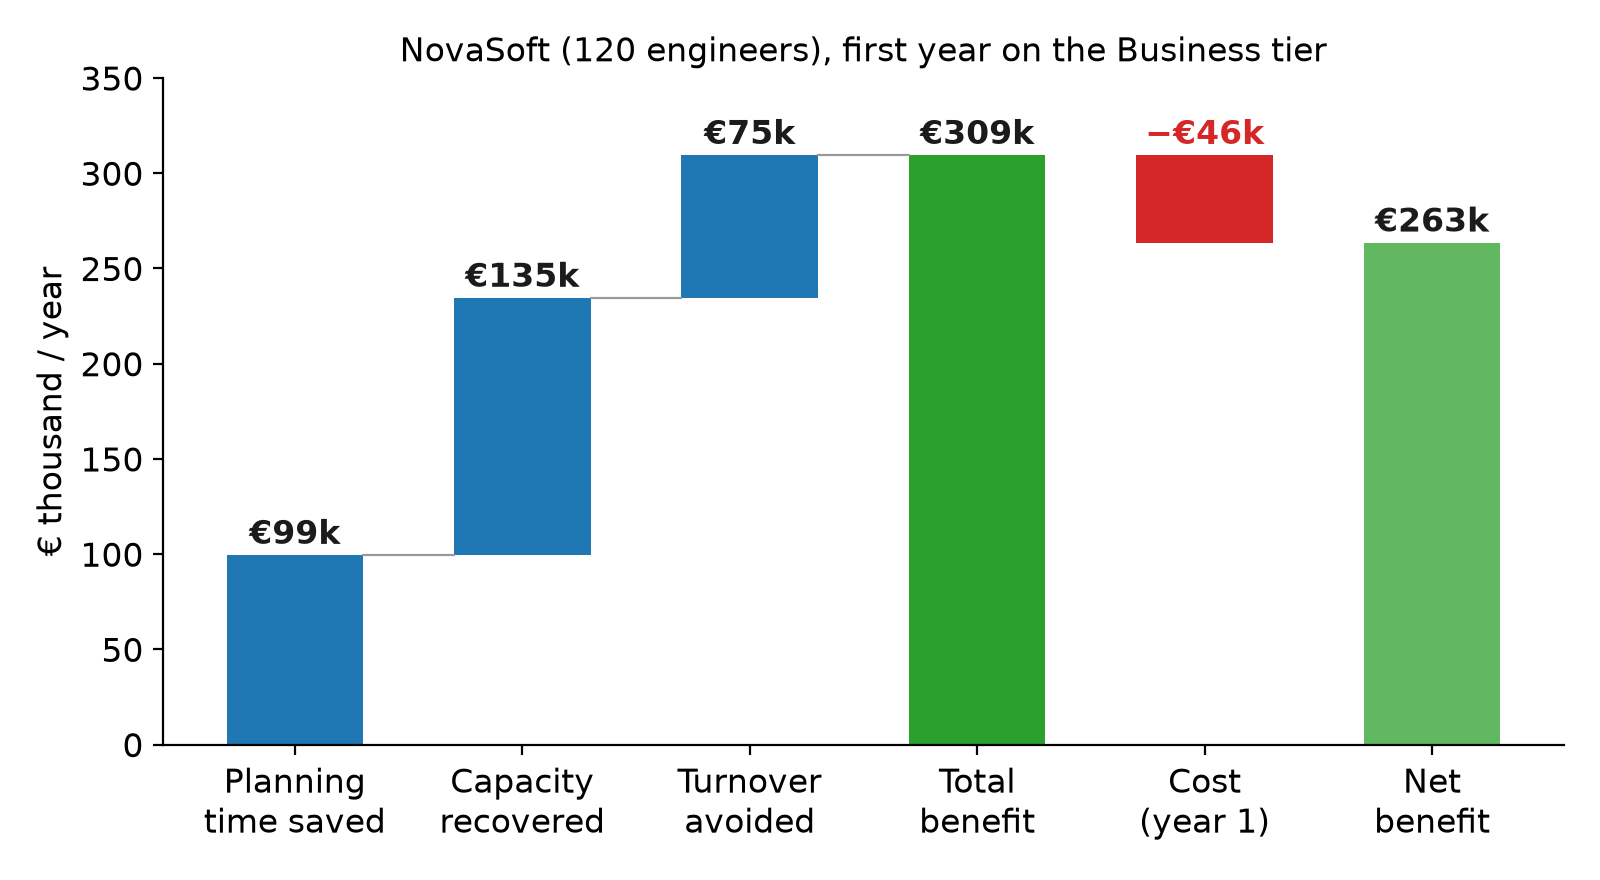
Source: Thesis §5.6, Table 7 (illustrative, conservative). Planning: 12 managers × 4 h/wk × 46 wks × €90/h × 50%. Capacity: 1.5% of €9.0M personnel cost (120 × €75k). Turnover: 2 leavers × 50% of €75k. Cost: 120 × €25 × 12 + €10k onboarding. ROI = (309,360 − 46,000) ÷ 46,000.
Business caseRobust under conservative assumptions
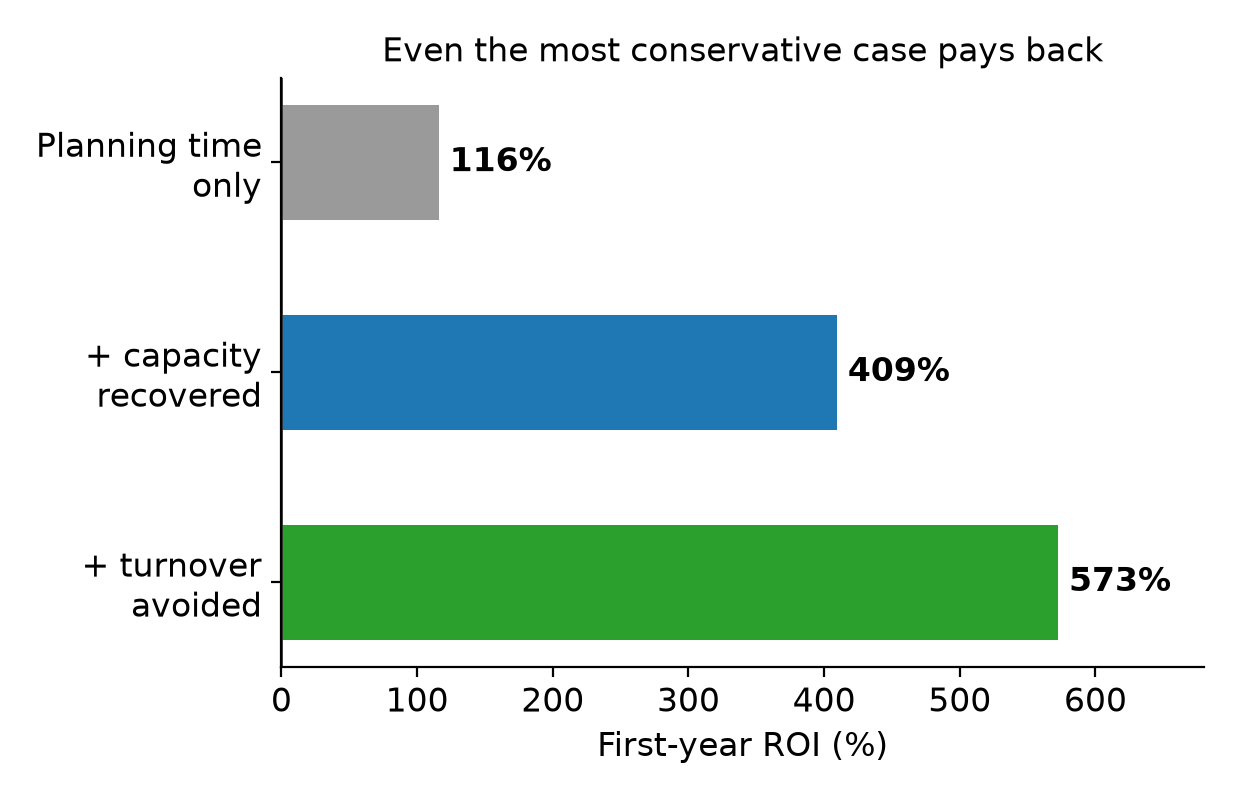
The planning-time saving alone covers the cost: about 116% ROI.
Capacity (+1.5%) and turnover (2 leavers avoided) are upside on top.
Source: Thesis §5.6: planning-time saving alone (€99,360) vs. €46,000 first-year cost ≈ 116% ROI. Each extra benefit added cumulatively from Table 7.
Business caseUnit economics & market
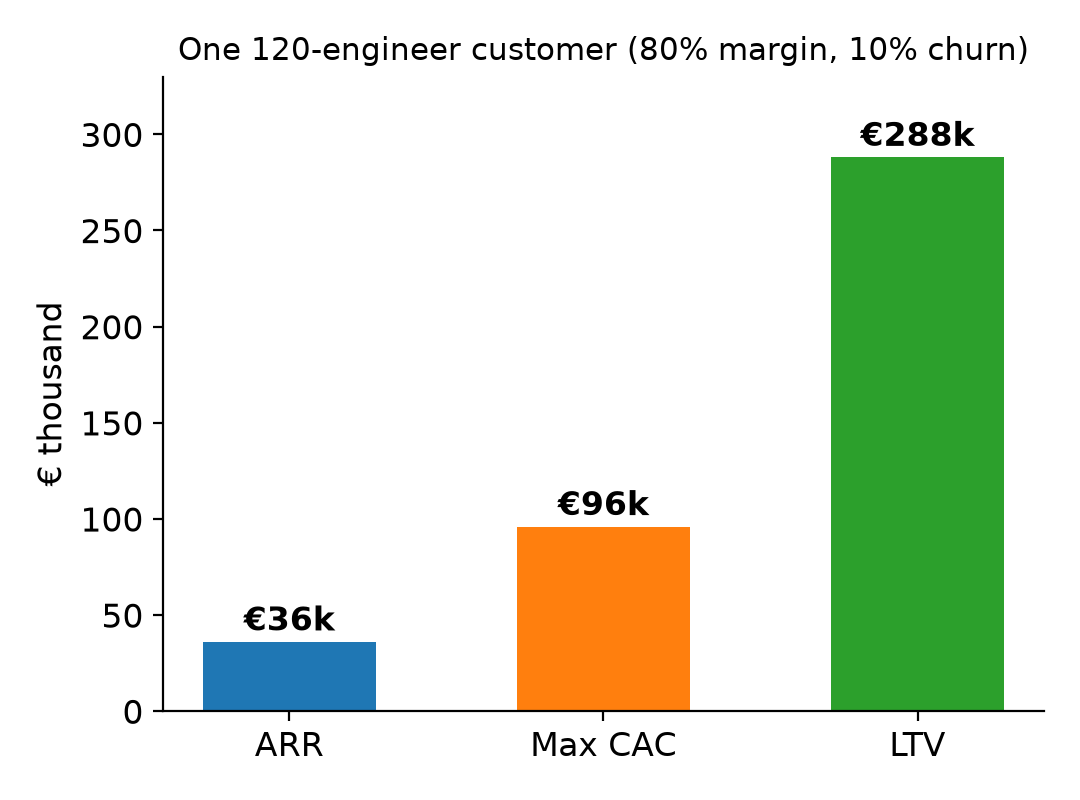
LTV:CAC = 3:1 · ~80% gross margin
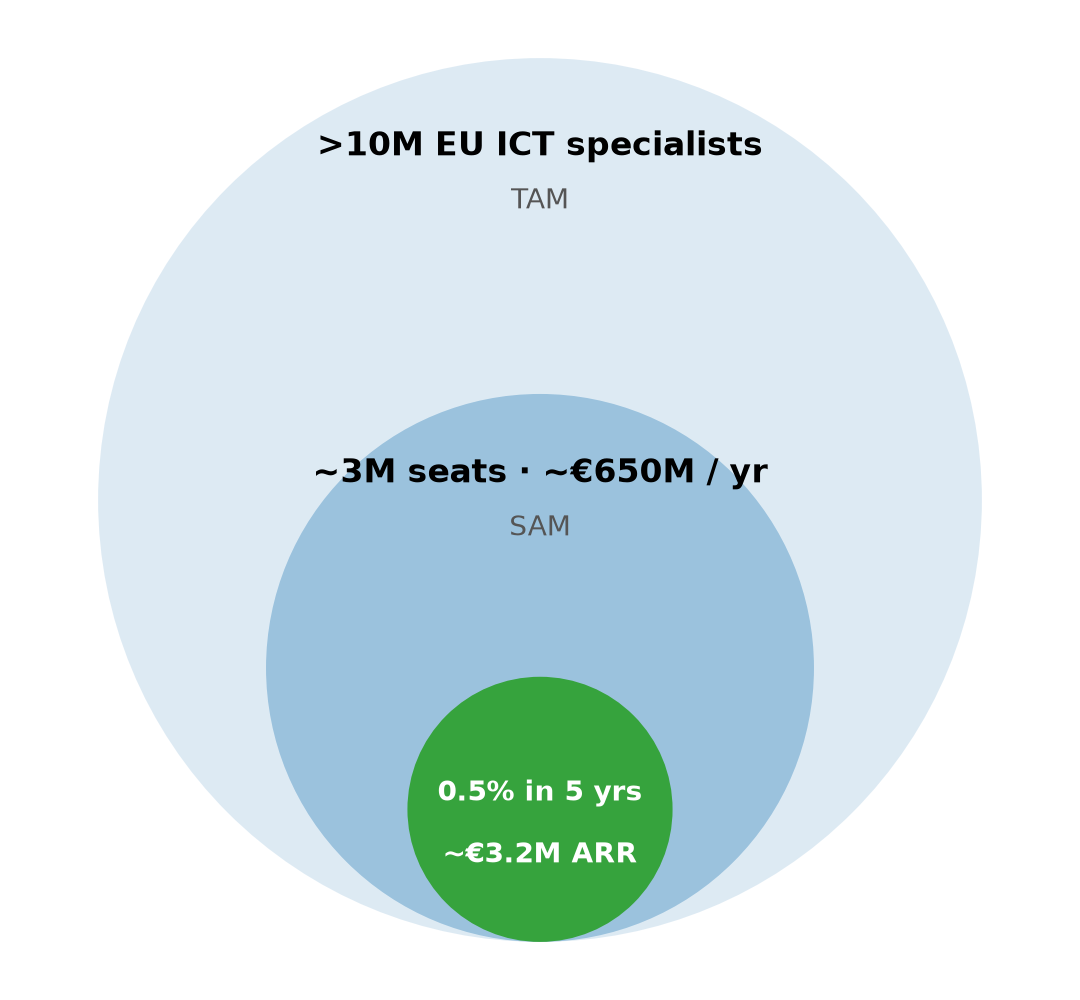
EU market: TAM → SAM → 5-year target
Source: Thesis §5.6. ARR = 120 × €25 × 12. LTV = €36k × 80% margin ÷ 10% churn. Max CAC = LTV ÷ 3 (Skok, 2013). Market: >10M EU ICT specialists (Eurostat, 2026); 30% in large-enough teams ≈ 3M seats × €18 blended × 12 ≈ €650M; 0.5% of seats ≈ €3.2M ARR.
Go-to-marketGo-to-market & risks
Beachhead
Mid-sized EU consultancies, where utilisation is revenue. Land via the free tier, expand when HR joins.
EU AI Act
Work allocation can be high-risk, so the audit log & human approval become selling points.
Trust
Team-level reporting and the right to decline.
Platform & model risk
Stay platform-neutral; the optimiser is a fallback; benchmark every new model.
Source: Thesis §5.7. Beachhead strategy: Moore (2014), Crossing the Chasm. EU AI Act (Regulation 2024/1689), Annex III, point 4(b).
TakeawaysConclusions
with a reason for every decision
a 120-engineer customer
market per year
Transparency and human control are both the product's edge and its answer to regulation.
Thank you · Questions?
Leonidas Boutsikaris
Source: Thesis §4.4.1 (7.0% mean gap), §5.6 / Table 7 (573% ROI, €650M serviceable market), §5.8 and §6.